
Buffer Overflow & GDB - Part 1
0x0ff.info is in english since very recenlty, to mark the occasion I chose to translate first the best articles of my french blog. Let’s begin our journey with a somewhat thorny and terrifying subject, gdb debugger 101!..

However, let’s not forget we are on a “nasty little hacker websitees” and not some devblog, this post will be carried out around a Buffer Overflow vulnerable program, a well-known system flaw, requiring tact and nimble fingers in order to exploit it.
Building up skills in debugging, or even in the exploitation of the various buffer overflow vulnerabilities is no easy matter. And discovering this universe on your own will require you to arm yourself with a certain load of patience, courage, and anti-migraine pills (not the blue ones)… But don’t worry, I walked past to somehow clear the way.
This course will be presented as an articles series, yes, you heard that right, series. While writing this introduction, two other articles are in the proofreading phase, and few more are in the drafting phase. This spread will bring a pinch of explanation here, and a spoonful of details there and in short to overcome this little something that may have stuck those who have already failed in getting it working in the first place.
Noob or insider, I hope you will be pleased by this insight…
Note: All links placed on keywords redirect to relevant pages, often Wikipedia. I invite you to follow them, none are commercial links!
DEBUGGER What’s what?
A debugger is a tool for debugging a program. This truism stated, here are some explanations. The ability to retrieve a certain amount of low level normally inaccessible information to the user (systemwise) during program execution is what a debugger makes possible, in other words, debbuging.. Many tools are available and allow you to debug a program: ptrace, ltrace, dmesg… But generally when we think debugger, Ollydbg or ida under Windows, and gdb under Linux are the most common answers you’ll get.
First of all, we’ll only be interested in gdb which allows dynamically disassembling a program into ELF (Executable and Linkable Format). Disassembling is the binary code (you know a bunch of zeros and ones) translation in assembly language instructions (asm). The tool gdb like Ollydbg does this work on the fly while the program is running. Conversely, Ida makes it possible to disassemble the program file without the need of executing it, doing so by recognizing certain patterns (groups of bytes) and identifying them as corresponding to certain instructions somewhat readable (but nothing alike an higher level programming language).
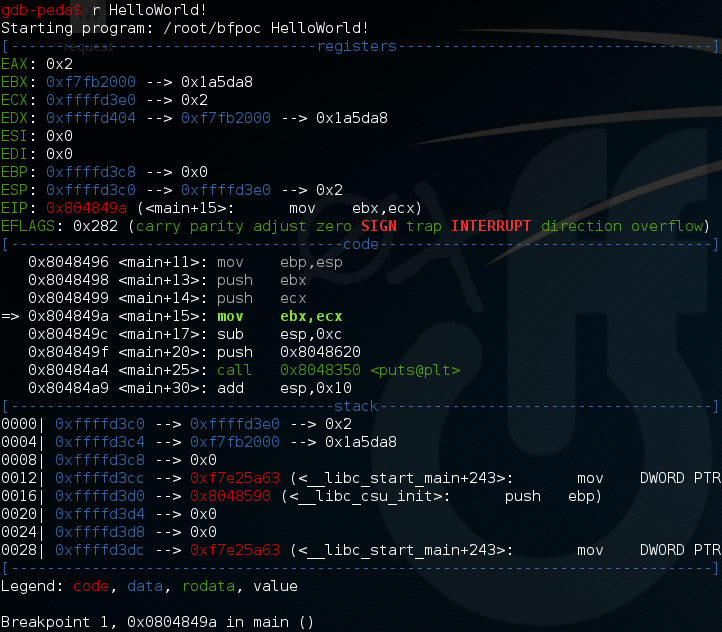
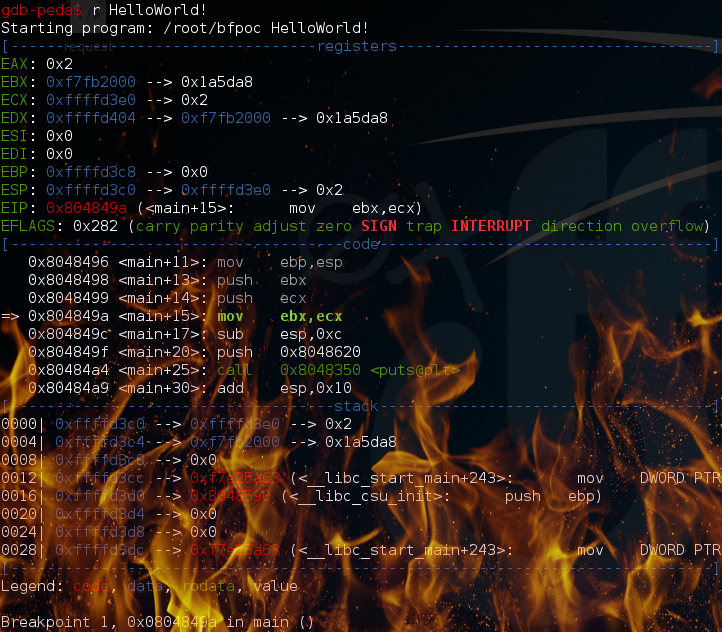
Above the gdb command line interface with the great peda overlay. Reaching critical mass yet? Don’t worry, you’ll learn to love it, and after a while you might even cherish it, embrassing it like second nature. Remember that quote from The Matrix when Cypher watches the Matrix goes by while talking to Neo, and tell yourself it’s the same:
… there’s way too much information to decode the Matrix. You get used to it, though. Your brain does the translating. I don’t even see the code. All I see is blonde, brunette, redhead. Hey uh, you want a drink?
Like all debuggers, gdb allows you to do a certain number of operations on a program that we’ll study in a while… To give you a quick overview of the possibilities that gdb offers, know that its main function is to provide a memory representation during program execution. Not very useful given the speed at which the execution of the said program takes place, you will say?
Yes, but gdb also allows you to pause the running program! Widely known as breakpoint and amongst gdb possible operations this one will most-likely become your favourite. It is possible to define several breakpoints and to navigate between them. When the program is stopped at a breakpoint, a memory representation is displayed and other information is available through certain commands.
It is also possible to execute the program instruction by instruction, also known as step. By instruction, I mean assembly language instruction (see image above, the “-*–code—*” block). As a reminder, the ASM language is the lowest level language still humanly readable before “0 and 1” made out of signals…
MEMORY
Let’s not get carried away, before getting to the core issue, it might be good to do a quick reminder on memory and processes. But don’t worry I won’t go into details, just give you a quick overview of how it all works, focusing on what is really relevant to exploiting buffer overflow with gdb. When you run a program, your processor will perform a number of calculations corresponding to the different lines of code in that program. To perform these calculations quickly, it needs to store certain data where they will be very quickly accessible, two solutions are available to him:
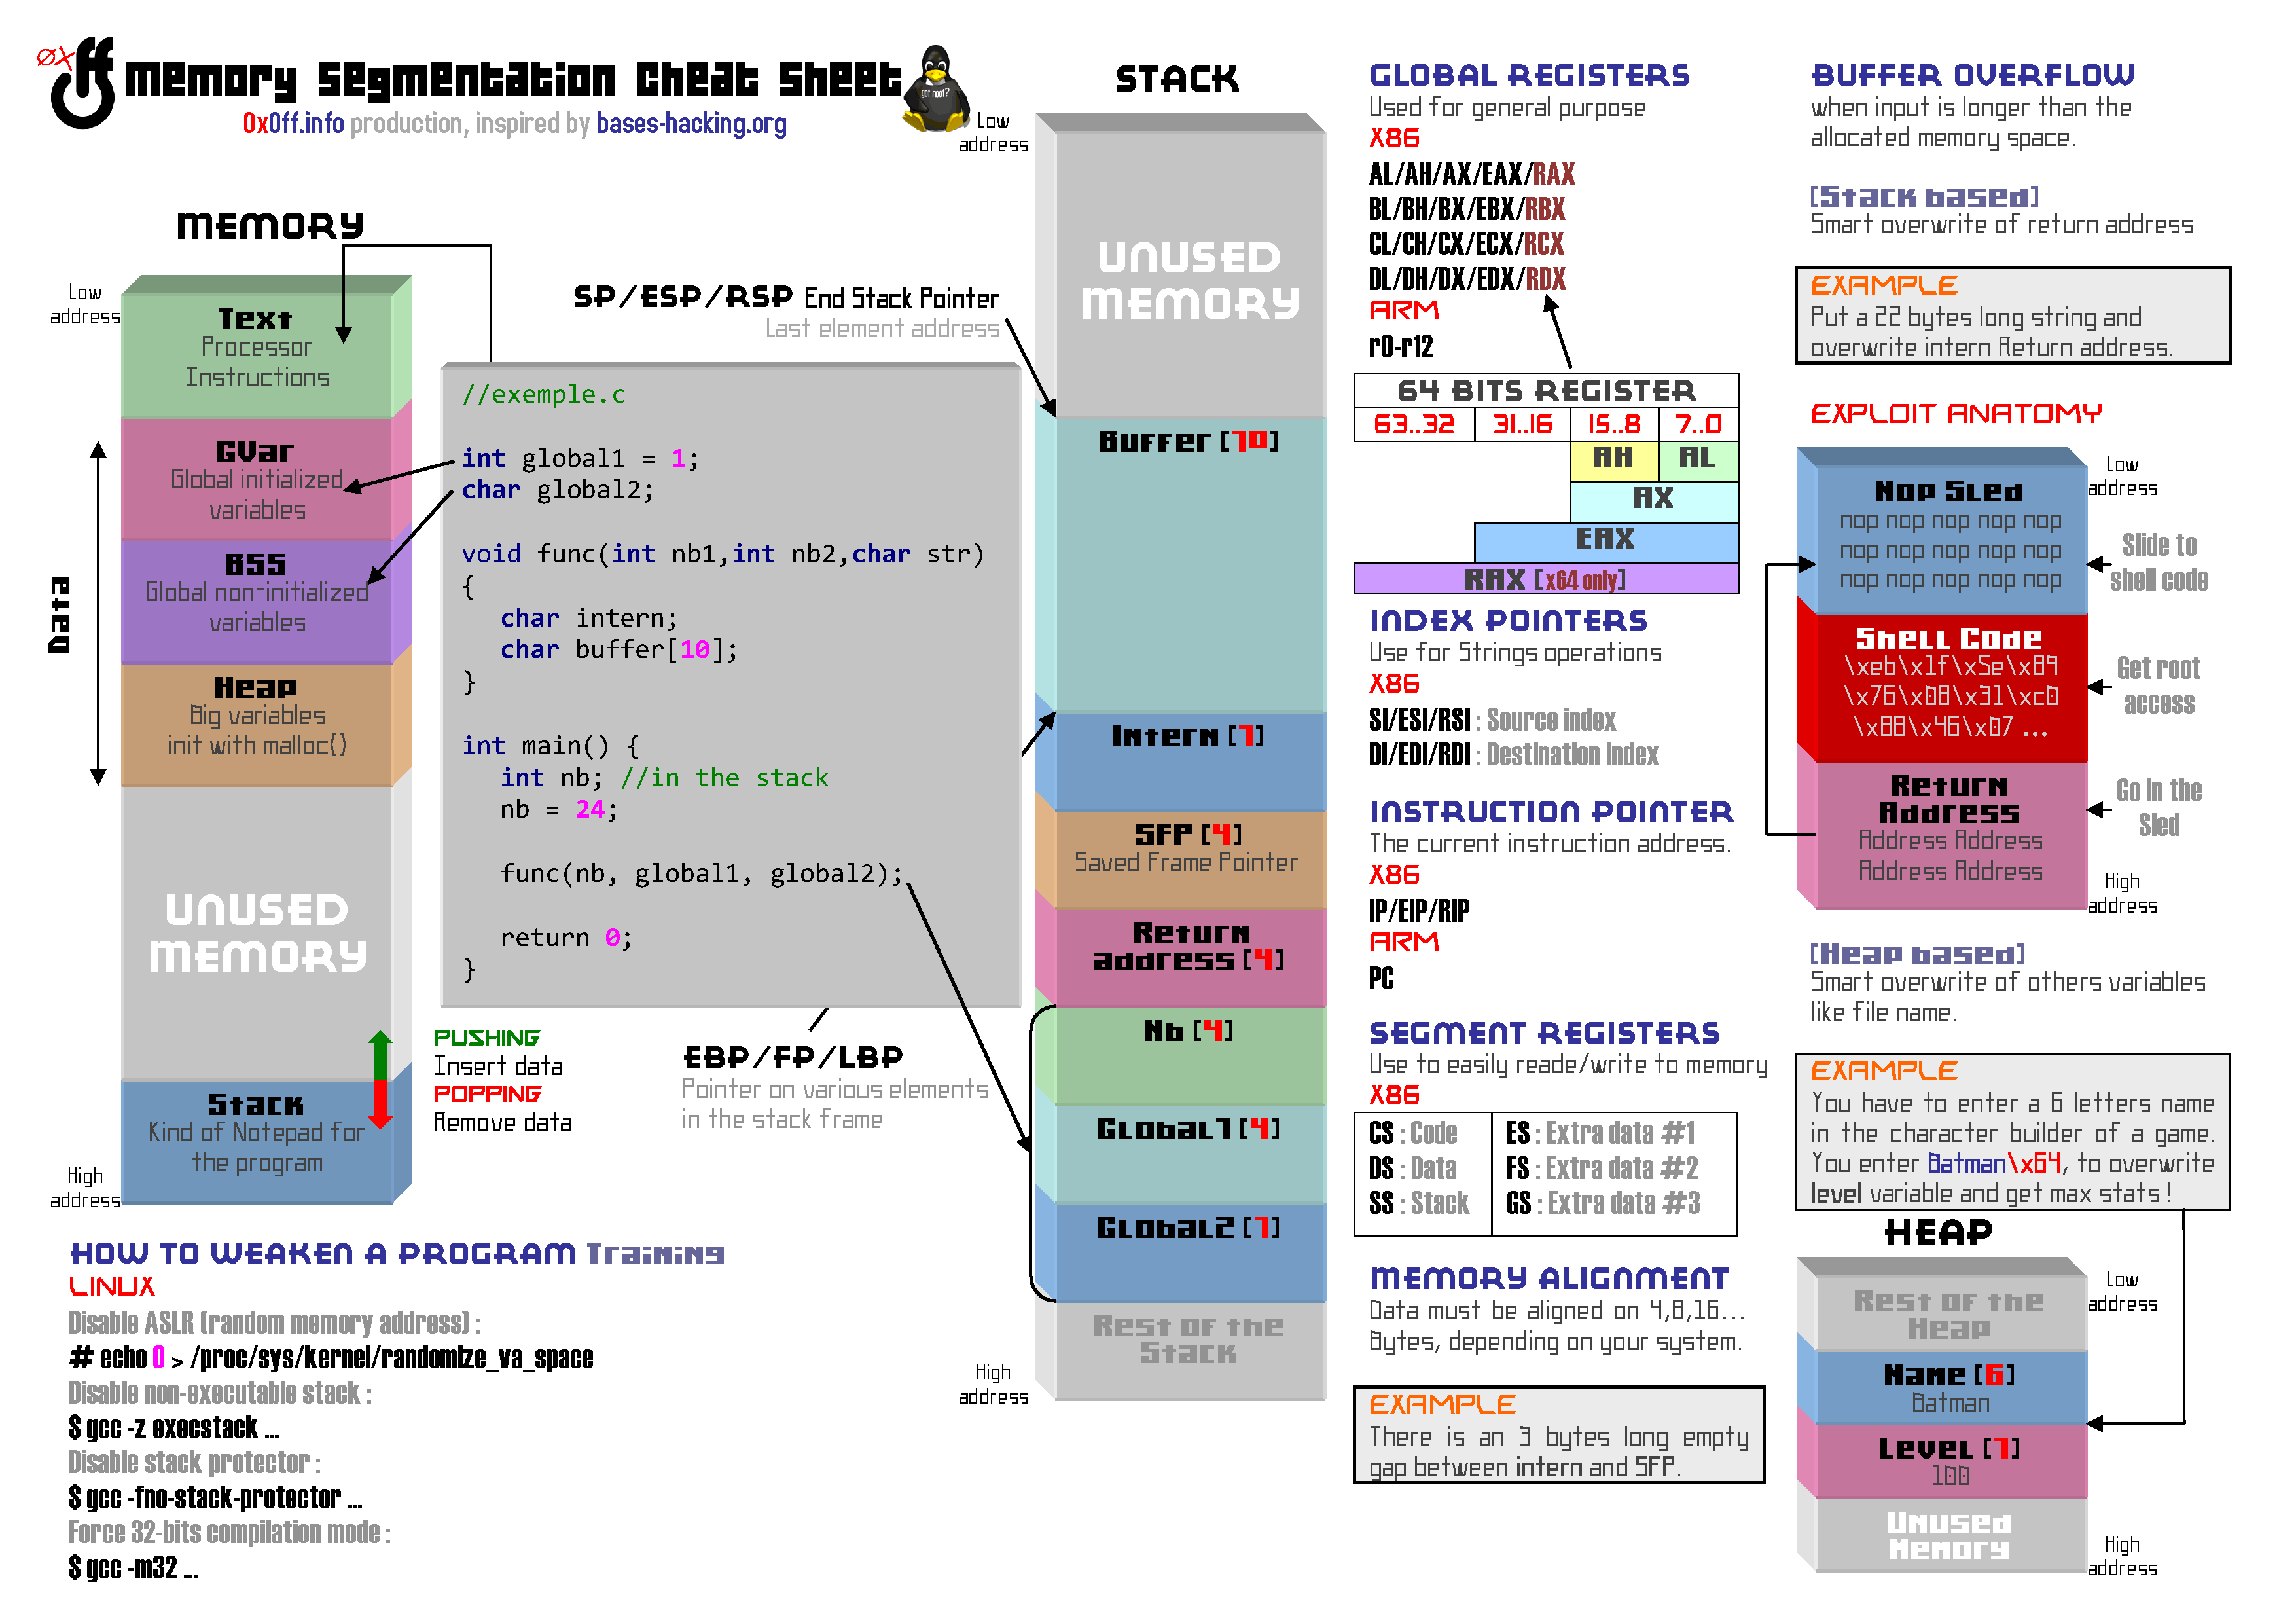
- Processor registers: on x86 we can quote EAX/EBX/EIP/ESP/EBP… In short, these are small memory spaces contained inside the processor and used for various things. You will find the details of these registers in the Cheat Sheet below.
- Random Access Memory: Most of the information necessary for your programs execution is stored in your RAM modules: variables, pointers, stack, heap, etc…
The memory space available in RAM is quite large. In order to quickly find the information bytes are numbered, these numbers are referred to as addresses. For example, at 0xbfffaabb (hexadecimal notation of the address), we’ll find the Random Access Memory 3221203643th byte.
 Small aside: This is excactly why 64bit systems allow you to add more RAM to your computer than 32bit systems. Indeed 32 or 64 bit refers to the length of the address bus (the part of a processor in charge of addressing), a 32bit system allows long addresses of 2^32 bits or 4 bytes (from 0x0 to 0xffffffff) and therefore 4294967296 different addresses. The first part of these addresses is reserved for certain resources (motherboard, graphics card, etc.) which leaves only around 3GB of RAM available to the programs. I’ll let you follow this same logic to find the limit of a 64bit system. 😋
If you refer to the infographic that I produced some time ago and which you can find below, you will notice that when a program is initialized, a certain number of the program-specific memory spaces are defined: ext, GVar, BSS, Heap, Stack… For the moment we are going to focus exclusively on the Stack which is a memory space where buffer overflows are common.
STACK
You have to imagine the stack as a kind of notepad adapted to your machine. This memory space acts like a catch-all, and contains almost all the variables and pointers used by the various functions of your programs. Each function has its own stack portion called stack frame…
One of the stack peculiarities is that it grows towards low addresses. That is, by declaring successively two variables a and b:
char a;
char b;
The variable a will have a bigger address than the variable b. For example 0xbfffa2 for a and 0xbfffa1 for b… I know I know, it’s not easy to understand but you will have to get used to it. Especially since it is not the hardest to assimilate…
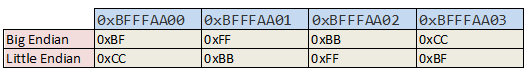
And yes, another cheerful memory feature in Linux is the Little Endian representation. As you probably know, the space taken by data in memory can vary (if you ignored it I advise you to take a look at this paper: Dirty types of data! not yet translated). The Little Endian or Big Endian format influences how the data is ordered. Imagine a pointer pointing to a string. This pointer, like all pointers on a 32 bit system is 4 bytes long (which is the size of an address, remember?). Let’s imagine that this pointer is located at the address 0xbfff aa00 and contains the address of the first character of our string 0xbfffbbcc, this is how it would be represented based on endianness.
    Big Endian    |    Little Endian
----------------- | -----------------
0xBFFFAA00 : 0xBF | 0xBFFFAA00 : 0xCC
0xBFFFAA01 : 0xFF | 0xBFFFAA01 : 0xBB
0xBFFFAA02 : 0xBB | 0xBFFFAA02 : 0xFF
0xBFFFAA03 : 0xCC | 0xBFFFAA03 : 0xBF
SETTING UP
PEDA INSTALLATION FOR GDB
Like any famous program, gdb brings together a community of creative people. And as so often this community is the source of great improvements. One of them is called PEDA for Python Exploit Development Assistance for GDB: https://github.com/longld/peda.
This overlay colors up the information mass provided by gdb, which is not a luxury touch! Here’s how to install it:
git clone https://github.com/longld/peda.git ~/peda
echo "source ~/peda/peda.py" >> ~/.gdbinit
echo "DONE! debug your program with gdb and enjoy"
WRITE A PROGRAM VULNERABLE TO BUFFER-OVERFLOW
First step for our gdb study, write a program vulnerable to Buffer Overflow because we are supposedly on an InfoSec Blog, for god’s sake!
#include <stdio.h>
#include <stdlib.h>
#include <string.h>

void funcMyLife();

main(int argc, char **argv)
{
 printf("[0] main() Start here.\n");
 if(argc != 2)
 {
 printf("[X] Usage : %s <message>\n", argv[0]);
 exit(0);
 }
 printf("[1] Calling funcMyLife().\n");
 funcMyLife(argv[1]);
 printf("[6] main() end at the next instruction. \n");
 return 0;
}

void funcMyLife(const char *arg)
{
 printf("[2] funcMyLife() Start here.\n");
 printf("[3] Variable buffer declaration.\n");
 char buffer[128];
 printf("[4] Calling strcpy(). <= [Vulnerability]\n");
 strcpy(buffer, arg);
 printf("\nMessage : %s\n\n", buffer);
 printf("[5] funcMyLife() end at the next instruction (ret).\n");
}
COMPILE OUR PROGRAM WHILE LIMITING THE PROTECTIONS
Unfortunately for you young hackers, IT evolved and continues to evolve rather quickly, and over the years many security features have been developed in order to make the exploitation of these vulnerabilities a real ordeal:
- ASLR protection (Address Space Layout Randomization) helps make the random process anatomy. At each new execution, the stored data is placed in different memory spaces.
- SSP protection (Stack-Smashing Protector) intercalates memory spaces between the useful data of the stack. The integrity of these spaces is checked. Any modification of these “Canaries” causes an immediate program interruption.
- No possible Stack or Heap execution, these memory spaces are intended to only contain variables and pointers but in no case executable code.
In order to simplify this introduction as much as possible, we are going to deactivate all these protections. We will also force the compilation to 32 bit (for those who use a 64 bit system):
 #Cette étape peut s'avérer nécessaire si votre système est en 64bit et que vous ne disposez pas des librairies permettant de compiler en 32bit
apt-get install libc6-dev-i386
# Désactiver l'ASLR
echo 0 > /proc/sys/kernel/randomize_va_space
# Compilation 32bit, stack exécutable, pas de stack protector
gcc -m32 -g -z execstack -fno-stack-protector ./bfpoc.c -o bfpoc
# This step may be necessary if your system is in 64bit and you do not have the libraries allowing to compile in 32bit
apt-get install libc6-dev-i386 # Disable ASLR
echo 0> / proc / sys / kernel / randomize_va_space # 32bit compilation, executable stack, no stack protector
gcc -m32 -g -z execstack -fno-stack-protector ./bfpoc.c -o bfpoc
HIGHLIGHTING THE BUFFER OVERFLOW
Now that we have made our vulnerable binary, we next have to highlight the Buffer Overflow. If you have made the effort to read the code, you should now know that the program takes the character string passed in parameter and copies into the buffer[128] variable a memory space which can theoretically contain 127 characters as well as the character end of string 0x00.
But let’s see first of all how this program behaves outside gdb and without any debugging tool… Because yes, carefully studying the behavior of a program saves time, it is therefore a reflex to integrate from now on.
NORMAL RUNNING
./bfpoc aaa
[0] main() Start here.
[1] Calling funcMyLife().
[2] funcMyLife() Start here.
[3] Variable buffer declaration.
[4] Calling strcpy(). <= [Vulnerability]

Message : aaa

[5] funcMyLife() end at the next instruction (ret).
[6] main() end at the next instruction.
1 BYTE MEMORY OVERFLOW
./bfpoc $(python -c 'print "a"*128')
[0] main() Start here.
[1] Calling funcMyLife().
[2] funcMyLife() Start here.
[3] Variable buffer declaration.
[4] Calling strcpy(). <= [Vulnerability]

Message : aaaaaaaaaaaaaaaaaaaaaaaaaaaaaaaaaaaaaaaaaaaaaaaaaaaaaaaaaaaaaaaaaaaaaaaaaaaaaaaaaaaaaaaaaaaaaaaaaaaaaaaaaaaaaaaaaaaaaaaaaaaaaaaa

[5] funcMyLife() end at the next instruction (ret).
[6] main() end at the next instruction.
Indeed, the data located just after the space reserved for the variable buffer[128] may have already been used, nor been essential, or perhaps the overwritten byte already contained the value 0x00. Without forgetting the concept of memory alignment which can cause unused memory gaps (See the paragraph Memory alignment of the article Dirty types of data!)…
By passing a 128 character string as a parameter, 129 characters are copied into the buffer[128] variable because of the automatically added string character 0x00 end. However this memory overrun does not generate an error… weird hey? Not necessarily… But we’ll this this another time.
SEGMENTATION FAULT #1
./bfpoc $(python -c 'print "a"*136')
[0] main() Start here.
[1] Calling funcMyLife().
[2] funcMyLife() Start here.
[3] Variable buffer declaration.
[4] Calling strcpy(). <= [Vulnerability]

Message : aaaaaaaaaaaaaaaaaaaaaaaaaaaaaaaaaaaaaaaaaaaaaaaaaaaaaaaaaaaaaaaaaaaaaaaaaaaaaaaaaaaaaaaaaaaaaaaaaaaaaaaaaaaaaaaaaaaaaaaaaaaaaaaaaaaaaaaa

[5] funcMyLife() end at the next instruction (ret).
[6] main() end at the next instruction.
Erreur de segmentation
By increasing the character count in our string passed as an argument, we end up getting what we are looking for: a significant Segmentation Fault error in the Buffer Overflow. However, it is not the one we are looking for because the error only occurs when exiting the main function …
SEGMENTATION FAULT #2
./bfpoc $(python -c 'print "a"*140')
[0] main() Start here.
[1] Calling funcMyLife().
[2] funcMyLife() Start here.
[3] Variable buffer declaration.
[4] Calling strcpy(). <= [Vulnerability]

Message : aaaaaaaaaaaaaaaaaaaaaaaaaaaaaaaaaaaaaaaaaaaaaaaaaaaaaaaaaaaaaaaaaaaaaaaaaaaaaaaaaaaaaaaaaaaaaaaaaaaaaaaaaaaaaaaaaaaaaaaaaaaaaaaaaaaaaaaaaaaa

[5] funcMyLife() end at the next instruction (ret).
Erreur de segmentation
You just have to push the plug a little further to finally find what you are looking for, a segmentation error preventing you from exiting the funcMyLife() function. This is very interesting for us, because it means that the Return Address of the function has been overwritten by what we entered. The Return Address is a pointer which is positioned at the start of the stack, when entering the function, and whose mission is to save the next instruction location to be executed when exiting the function.
CONCLUSION OF PART 1
And There you go ! This first part ends here and I feel like you might be bubbling “Pfff! We haven’t even started gdb, what a scam!”. Yes, true, but admit that it was not so uninteresting after all… What is certain is that it was important to see or review the basics before onboarding on the Debuggers, Buffer Overflow adventure, all of those are relatively sophisticated subjects and it is essential to know exactly what you are doing and why you are doing it. Consider that the foundation has just been laid. We will tackle the structural work in part 2, and I promise you from now on, we will use gdb.
Translated from 0x0ff.info by @Razcall_.

Comments